Before we discuss why we need to “look beyond the MEAN”, let us refer to the definition of MEAN and then review a few examples to set the context for this article.
The Arithmetic Mean is the average of the numbers: a calculated “central” value of a set of numbers. To calculate it, add up all the numbers and then divide the sum by how many numbers there are. Example: the mean of 2, 7 and 9 is 6 [(2+7+9)/3] (Source: Maths is Fun).
Example 1: Online Store for Baby Products
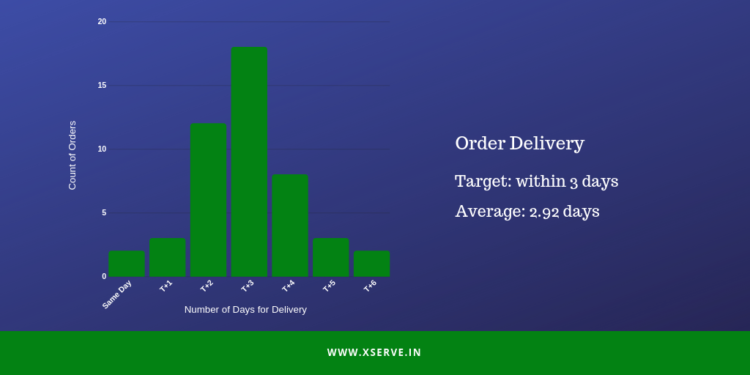
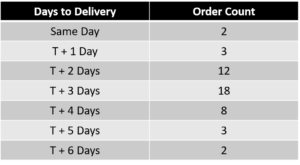
Nisha is a small business owner. She had started her online store for baby products a year ago. Business had picked up after the first few months. She now receives 6 to 8 orders per day. She has a team of 3 employees. “On time delivery” is an important parameter for her business and they promise deliveries within 3 days to all customers. Nisha reviews on time delivery performance every week with her team. Given below is the summary for last week:
Orders received: 48
Average delivery time: 2.92 days
On an average, every order was delivered within the 3 days target set by Nisha. However, if Nisha would look at the distribution of data, more than 1/4th orders were delivered late – 13 out of total 48 (27%).
Nisha and team need to look at the entire distribution and not just the “Mean” or average delivery time. How would the 2 customers rate their shopping experience who received the product on the 6th day?
Example 2: Customer Helpdesk
ABC Pvt Ltd is a leading internet service provider and employs a team of 120 customer service representatives to manage their inbound call center. While reviewing customer feedback, they identified “call wait time” as one of the major dissatisfiers for customers who contact the helpdesk. During peak hours, wait time could be as high as 7 to 8 minutes.
The management team introduced “Average Call Wait Time” as a key metric for the customer helpdesk. The target was to maintain an average call wait time of less than 3 minutes. The team managed to reduce the call wait time. In the 3rd month, they reported an average call wait time of 2 minutes, 27 seconds (Mean).
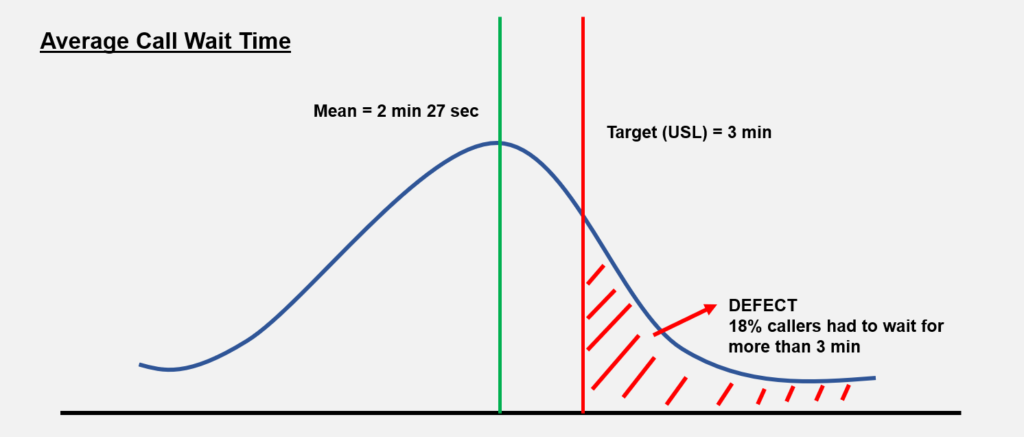
However, if we review the overall call distribution, 18% callers had to wait for more than 3 minutes. Some callers had to wait beyond 4 minutes. While the team had managed to significantly reduce the call wait time, they need to continuously improve the performance to reduce the variation.
Both Nisha and ABC Pvt Ltd need to “look beyond the MEAN”. Hence, along with the Mean or the arithmetic average, they need to observe the variation in the process.
The extremes on both sides of the curve strongly influence customer behavior. A customer who had to wait for 6 days will most likely be dissatisfied and may not return for a second purchase. A caller may hang up after waiting for 4 minutes in the call queue and hence the query would remain unanswered and unresolved.
Do you measure the variation for your business processes?
Do you look at the extreme values?
While there are statistical tools to monitor data distribution and variation, small businesses can follow a simple approach to “look beyond the mean”:
- Set service level goals or specification limits for all key customer metrics (on time delivery, turnaround time etc.)
- Set up a data reporting and monitoring schedule
- Along with the mean, observe the variation – monitor the count and percentage values beyond the desired service level or specification limits (Example: count and percentage of orders delivered after 3 days, count and percentage of callers who had to wait for more than 3 minutes, count or percentage of inquiries not responded to in 24 working hours)
Understanding the variation along with the average performance and addressing the root causes for variation will help you better conform to customer expectations.
I have been searching to find a comfort or effective procedure to complete this process and I think this is the most suitable way to do it effectively. ExcelR Data Scientist Courses In Pune
Just saying thanks will not just be sufficient, for the fantastic lucidity in your writing. I will instantly grab your articles to get deeper into the topic. And as the same way ExcelR also helps organisations by providing data science courses based on practical knowledge and theoretical concepts. It offers the best value in training services combined with the support of our creative staff to provide meaningful solution that suits your learning needs. Business Analytics Course in pune
Thank you for helping people get the information they need. Great stuff as usual. Keep up the great work!!!
360digitmg
Thanks for taking the time to discuss this, I feel strongly about it and love learning more on this topic. If possible, as you gain expertise, would you mind updating your blog with extra information? It is extremely helpful for me. top family pets