
Most business meetings, reviews, dashboards focus on the key performance indicators (KPIs) as a measure of success. These KPIs are the output or outcome of a business process or a combination of processes. In a transfer function, an outputs is denoted as “Y”. However, it is difficult to have a direct control on “Y” or process output without identifying, monitoring and controlling the various inputs to the process – the many “X”s.
There are some or many input parameters that affect the output. Hence, the output (Y) is a function of (X). To achieve the desired output or business success, it is important to determine the inputs that affect the output. As a business owner or manager, have you determined the relationship between your process inputs (Xs) and process outputs (Ys).
Let us consider an example. Tina runs a digital marketing agency, XYZ Marketing, and caters to local businesses. The total monthly expenses for XYZ Marketing is Rs. 3,50,000 per month. Tina has set a monthly sales goal of Rs. 5,50,000. So her Y is sales goal of Rs. 5,50,000.
While Tina would share, coach and review her team to ensure they achieve the goal, it would be better if she identifies the controllable inputs (Xs) and sets targets for each X. It is breaking down the unpredictable big Y into smaller controllable and manageable Xs.
Tina analyzes historical data, meets her team and sets clear goals for Xs that will help XYZ Marketing achieve the sales goal of Rs. 5,50,000 in 6 months.
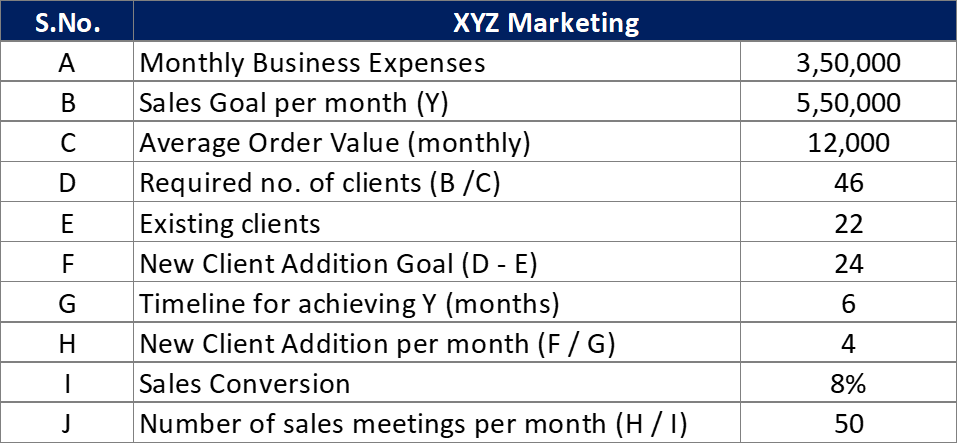
With an average monthly deal size of Rs 12,000 and a timeline of 6 months to achieve the goal, as explained in the table above, XYZ Marketing needs to acquire 4 new clients each month. They have a sales meeting to deal conversion of 8%. Hence to add 4 new clients, the team needs 50 sales meetings per month. This is one of the Xs. Tina can now set weekly and daily sales meeting targets for the team. Breaking it down one step further, they can check the lead database to sales meeting conversion. That will help them arrive at a number of new leads they need each month to set 50 sales meetings. The lead generation goal can be further divided into various sources – website leads, email marketing, exhibitions, client references and so on.
Identifying the easier to manage, smaller inputs (Xs), Tina is able to give specific and achievable targets to her team.
Have you determined the transfer function for your business success?
What are the various inputs (Xs) that impact the bigger business outcomes (Ys)?
Here are a couple of ways to identify the drivers of your business outcome:
- A brainstorming session with your team and one or two external experts or buyers of your service. Use a CTQ drill down method or a Fishbone analysis
- A statistical analysis if you have the data available. Here you can seek assistance from an external expert. A statistical analysis of historical data will help you quantify the goals and improvement needed in each X to achieve the desired outcome (Y). In the example listed above, Tina could use data from the sales CRM to check conversion at various stages of the sales process. Similarly, they could check website analytics and email campaign statistics for lead generation goals.
If you have specific queries about how to determine the drivers for your business, please contact for a free phone consultation.
1 comment